

Question: Graphically find the cross-correlation c Æh (x) of the two functions shown here: Figure P.11.41 How wide will it be? At what value of x
Figure P.11.41
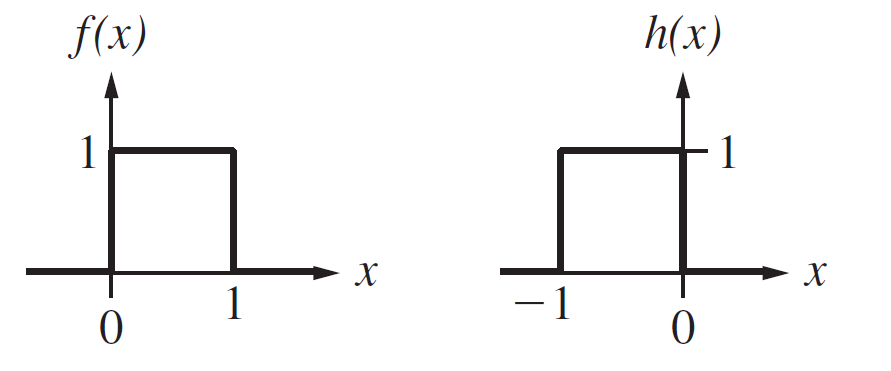
How wide will it be? At what value of x will the correlation peak? What is the maximum value of cÆ’h(x)? Is it symmetrical? Slide either one over the other.
f(x) h(x) 1 1 -1
Step by Step Solution
★★★★★
3.38 Rating (167 Votes )
There are 3 Steps involved in it
1 Expert Approved Answer
Step: 1 Unlock

The width of gX is the sum of th... View full answer
Question Has Been Solved by an Expert!
Get step-by-step solutions from verified subject matter experts
Step: 2 Unlock
Step: 3 Unlock