

Question: The graphs in Fig. P.4.98 are the reflection spectra for several roses seen in white light. The flowers were white, yellow, light pink, dark pink,
Fig P.4.98
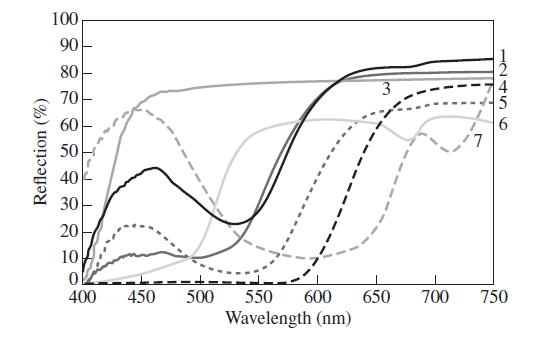
100 90 80 70 60 50 40 30 20 10 450 650 400 500 550 600 700 750 Wavelength (nm) Reflection (%)
Step by Step Solution
★★★★★
3.43 Rating (175 Votes )
There are 3 Steps involved in it
1 Expert Approved Answer
Step: 1 Unlock

Graph 1 2 3 4 5 ... View full answer
Question Has Been Solved by an Expert!
Get step-by-step solutions from verified subject matter experts
Step: 2 Unlock
Step: 3 Unlock