

Question: Use the phasor method, described in conjunction with Fig. 7.17, to explain how two equal-amplitude waves of sightly different frequencies generate the beat pattern shown
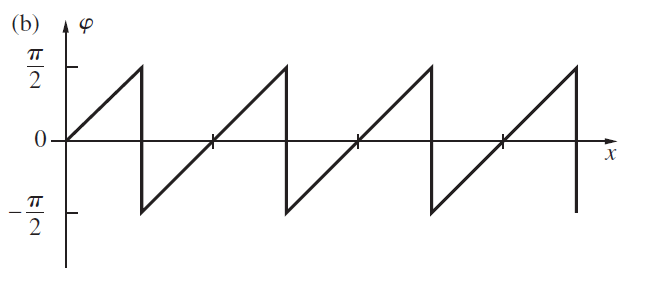
Use the phasor method, described in conjunction with Fig. 7.17, to explain how two equal-amplitude waves of sightly different frequencies generate the beat pattern shown in Fig. 7.19 or Fig. P.7.19a. The curve in Fig. P.7.19b is a sketch of the phase of the resultant measured with respect to one of the constituent waves. Explain its main features. When is it zero and why? When does the phase change abruptly and why?
Fig. 7.17
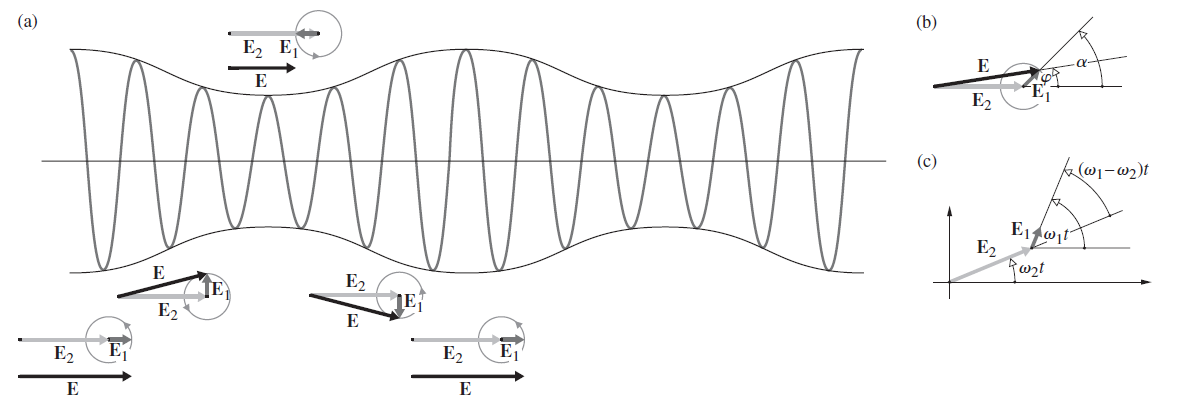
Fig. 7.19
Fig. 7.19 b
(b) (a) E2 E E2 (c) .(- ))t E1wit E2 E2 E2 E1 E2 E2 Absorption band n(v)
Step by Step Solution
3.46 Rating (179 Votes )
There are 3 Steps involved in it
One can see that the relative phase of the two waves varies and that a maximum o... View full answer

Get step-by-step solutions from verified subject matter experts