

Question: Convert the data given in the table below into charts or graphs and prepare a slide for the same. Product Text books Reference books Fiction
Convert the data given in the table below into charts or graphs and prepare a slide for the same.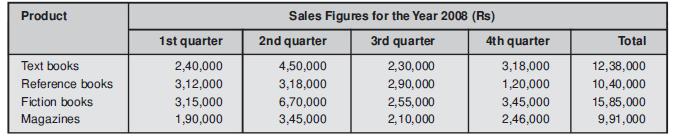
Product Text books Reference books Fiction books Magazines Sales Figures for the Year 2008 (Rs) 1st quarter 2nd quarter 3rd quarter 4th quarter Total 2,40,000 4,50,000 2,30,000 3,18,000 12,38,000 3,12,000 3,18,000 2,90,000 1,20,000 10,40,000 3,15,000 6,70,000 2,55,000 3,45,000 15,85,000 1,90,000 3,45,000 2,10,000 2,46,000 9,91,000
Step by Step Solution
There are 3 Steps involved in it
1 Expert Approved Answer
Step: 1 Unlock

Question Has Been Solved by an Expert!
Get step-by-step solutions from verified subject matter experts
Step: 2 Unlock
Step: 3 Unlock