

Question: Figure 20. 26 shows the energy changes for a certain system over a short time interval. Describe what is happening to the system. From the
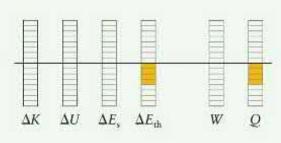
Figure 20. 26 shows the energy changes for a certain system over a short time interval. Describe what is happening to the system. From the diagram, what can you conclude about the temperature of the environment at the beginning of the time interval?
Data from Figure 20. 26
AK AU , W Q
Step by Step Solution
★★★★★
3.33 Rating (162 Votes )
There are 3 Steps involved in it
1 Expert Approved Answer
Step: 1 Unlock

The thermal energy of the system is decreasing leftDelt... View full answer
Question Has Been Solved by an Expert!
Get step-by-step solutions from verified subject matter experts
Step: 2 Unlock
Step: 3 Unlock