

One or more of the graphs in Figure (mathbf{2} .15) represent an impossible motion. Identify which ones
Question:
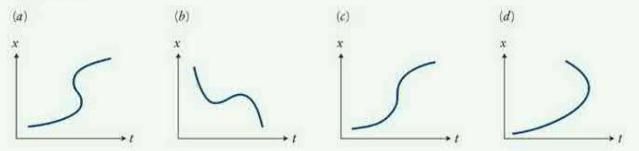
One or more of the graphs in Figure \(\mathbf{2} .15\) represent an impossible motion. Identify which ones and explain why the motion is not possible.
Data from Figure 2. 15
Fantastic news! We've Found the answer you've been seeking!
Step by Step Answer:
a and d Put the left edge of a ruler along the x axis and slowly slide the ruler to the rig...View the full answer

Answered By
Anjali Arora
Having the experience of 16 years in providing the best solutions with a proven track record of technical contribution and appreciated for leadership in enhancing team productivity, deliverable quality, and customer satisfaction. Expertise in providing the solution in Computer Science, Management, Accounting, English, Statistics, and Maths.
Also, do website designing and Programming.
Having 7 yrs of Project Management experience.
100% satisfactory answers.
3+ Reviews
10+ Question Solved
Related Book For 

Question Posted:
