

The motion of a cart moving along a horizontal surface is described by the motion diagram shown
Question:
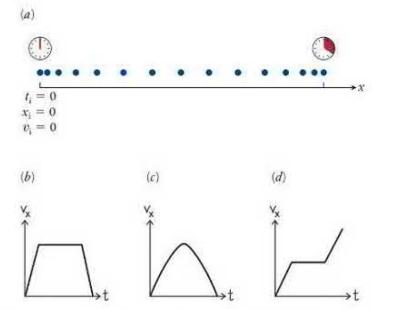
The motion of a cart moving along a horizontal surface is described by the motion diagram shown in Figure P3.25a. The position of the cart is measured every \(0.5 \mathrm{~s}\). Asked to suggest a qualitative graph of velocity versus time that would correspond to this motion, three of your classmates draw the graphs shown in Figures P3.25b-d. Which graph is correct?
Data from Figures P3.25a-d
Step by Step Answer:

This question has not been answered yet.
You can Ask your question!
Related Book For 

Question Posted:
