

The (P V) diagram in Figure P20.41 shows two processes for taking an ideal gas from an
Question:
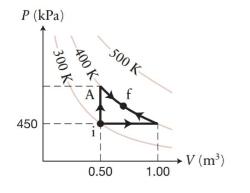
The \(P V\) diagram in Figure P20.41 shows two processes for taking an ideal gas from an initial state i to a final state \(\mathrm{f}\). How much work is done on the gas in the isochoric leg labeled A?
Data from Figure P20.41
Fantastic news! We've Found the answer you've been seeking!
Step by Step Answer:

Answered By
Pushpinder Singh
Currently, I am PhD scholar with Indian Statistical problem, working in applied statistics and real life data problems. I have done several projects in Statistics especially Time Series data analysis, Regression Techniques.
I am Master in Statistics from Indian Institute of Technology, Kanpur.
I have been teaching students for various University entrance exams and passing grades in Graduation and Post-Graduation.I have expertise in solving problems in Statistics for more than 2 years now.I am a subject expert in Statistics with Assignmentpedia.com.
3+ Reviews
10+ Question Solved
Related Book For 

Question Posted:
