

The diagram shows part of the curve with equation y = f(x), where f(x) = x 2
Question:
The diagram shows part of the curve with equation y = f(x), where f(x) = x2 − 7x + 5 ln x + 8, x > 0. The points A and B are the stationary points of the curve.
a. Using calculus and showing your working, find the coordinates of the points A and B.
b. Sketch the curve with equation y = −3f(x − 2).
c.. Find the coordinates of the stationary points of the curve with equation y = −3f(x − 2). 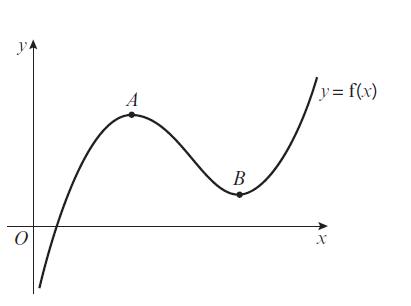 State, without, proof, which point is a maximum and which point is a minimum.
Fantastic news! We've Found the answer you've been seeking!
Step by Step Answer:
a 1 2 5 ln...View the full answer

Answered By
ANDREW KIPRUTO
Academic Writing Expert
I have over 7 years of research and application experience. I am trained and licensed to provide expertise in IT information, computer sciences related topics and other units like chemistry, Business, law, biology, biochemistry, and genetics. I'm a network and IT admin with +8 years of experience in all kind of environments.
I can help you in the following areas:
Networking
- Ethernet, Wireless Airmax and 802.11, fiber networks on GPON/GEPON and WDM
- Protocols and IP Services: VLANs, LACP, ACLs, VPNs, OSPF, BGP, RADIUS, PPPoE, DNS, Proxies, SNMP
- Vendors: MikroTik, Ubiquiti, Cisco, Juniper, HP, Dell, DrayTek, SMC, Zyxel, Furukawa Electric, and many more
- Monitoring Systems: PRTG, Zabbix, Whatsup Gold, TheDude, RRDtoo
Always available for new projects! Contact me for any inquiries
1+ Reviews
10+ Question Solved
Related Book For 

Pearson Edexcel A Level Mathematics Pure Mathematics Year 2
ISBN: 9781292183404
1st Edition
Authors: Greg Attwood, Jack Barraclough, Ian Bettison, David Goldberg, Alistair Macpherson, Joe Petran
Question Posted:
