

You are part of a team working on the development of a process in which a mineral
Question:
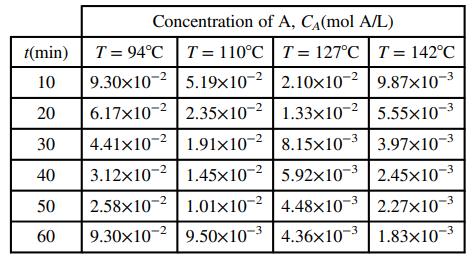
You are part of a team working on the development of a process in which a mineral species (labeled A for proprietary reasons) undergoes a reaction to form a new pigment to be used in house paints. In a series of experiments in a large well-mixed stirred tank reactor, you fill a tank with a known quantity of an inert liquid, bring the liquid up to a specified temperature, add a known quantity of A, and measure the concentration of A in the tank as a function of time. The reaction gives off heat as it progresses, but cooling water circulating in a jacket around the reactor keeps the temperature of the reacting mixture constant. The following data are recorded.
A research article indicates that concentration of A should vary with time according to the following expression:
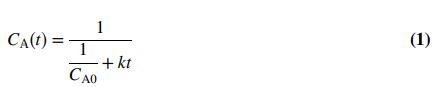
where CA0 (mol/L) is the initial concentration of A in the reactor (CA(t = 0)) and k is called the reaction rate constant. Despite being called a constant, k is a strong function of the absolute temperature in the reactor:
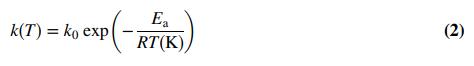
In this equation (known as the Arrhenius equation after the Swedish chemist who proposed it), k0 is a constant, Ea(J/mol) is the reaction activation energy, and R = 8.314 J/(mol•K) is the universal gas constant. Your task will be to verify that the expressions for CA(t) and k(T) fit the data, and if they do, to determine the parameters CA0 and k at each temperature and then the constants k0 and Ea. (a) What are the units of k, k0, and Ea if CA is in mol/L and t is in min?
(a) What are the units of k, k0, and Ea if CA is in mol/L and t is in min?
(b) Transform Equation 1 into an equation of the form y = at + b, so that if Equation 1 is valid, a plot of y vs. t would be a straight line. How would you determine CA0 and k from the slope and intercept of the line?
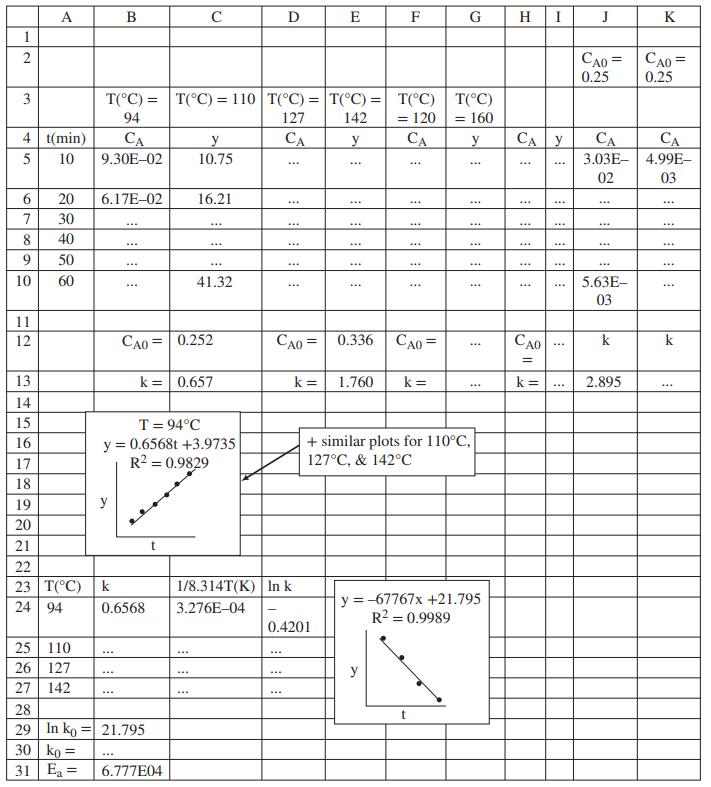
(c) Create an Excel spreadsheet with the structure shown as Rows 1–10 in the figure at the end of this problem statement, and fill in the data table in Columns A–I. Then create the four scatterplots shown in Rows 15–21. In the “Trendline” options of each plot, check the boxes for “Display equation on chart” and “Display R-squared value on chart” but not the one for “Set intercept.” R2 is the coefficient of determination (it has several other names as well), and provides a measure of how well a straight line fits a set of data: the closer it is to 1, the better the fit. What can you conclude about Equation 1 from the four plots?
(d) From the four trendline equations, calculate the values of k and CA0 for each of the four experimental temperatures and fill in Columns B–I in Rows 12 and 13 of the spreadsheet.
(e) Enough A was initially added to the tank to make the initial concentration CA0 = 0.25 mol/L, yet you calculated four different values of CA0 in Part (d). How do you explain this result?
(f) Next, transform Equation 2 so that a straight-line plot (y = ax + b) would enable you to calculate the parameters k0 and Ea. Below the four charts of Part (c), insert the information shown in Rows 23–27, Columns A–D, filling in the k values from the results of Part (d). Create the appropriate plot, show the trendline equation and R2 value, use the equation to determine k0 and Ea, and fill in Columns A and B in Rows 29–31. What can you conclude about the temperature dependence of the reaction rate constant?
g) In running this set of experiments, it is essential that the reactor temperature be carefully controlled and the reactor contents be very well mixed. Speculate on the probable reasons for both requirements.
(h) Finally, create and fill in Rows 1–3 and 12 of Columns J and K. Use Equation 2 to calculate k at 120°C and 160°C and insert them in Cells J13 and K13, respectively. Then fill in Rows 5–10 of Columns J and K using Equation 1 and assuming an initial concentration CA0 = 0.25 mol/L. In which of the two sets of estimated concentrations would you have more confidence? Explain your answer.
Step by Step Answer:

This question has not been answered yet.
You can Ask your question!

Elementary Principles of Chemical Processes
ISBN: 978-1119498759
4th edition
Authors: Richard M. Felder, Ronald W. Rousseau, Lisa G. Bullard
