

Question: In the graph shown here, velocity is plotted as a function of time for an object traveling in a straight line. a. Is the velocity
In the graph shown here, velocity is plotted as a function of time for an object traveling in a straight line.
a. Is the velocity constant for any time interval shown? Explain.
b. During which time interval is shown does the object have the greatest acceleration? Explain.
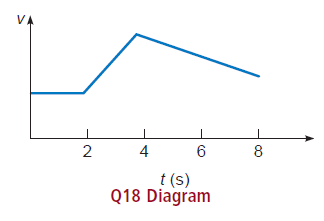
2 4 8 t (s) Q18 Diagram
Step by Step Solution
★★★★★
3.36 Rating (165 Votes )
There are 3 Steps involved in it
1 Expert Approved Answer
Step: 1 Unlock

The graph between the velocity and time is as shown below a The velocit... View full answer
Question Has Been Solved by an Expert!
Get step-by-step solutions from verified subject matter experts
Step: 2 Unlock
Step: 3 Unlock
Document Format (2 attachments)
1575_60619c5a650f0_743715.pdf
180 KBs PDF File
1575_60619c5a650f0_743715.docx
120 KBs Word File