

Question: Create a graph showing expected cost versus the probability of an unsuccessful search when performing sequential search (see Section 9.1). What can you say qualitatively
Create a graph showing expected cost versus the probability of an unsuccessful search when performing sequential search (see Section 9.1). What can you say qualitatively about the rate of increase in expected cost as the probability of unsuccessful search grows?
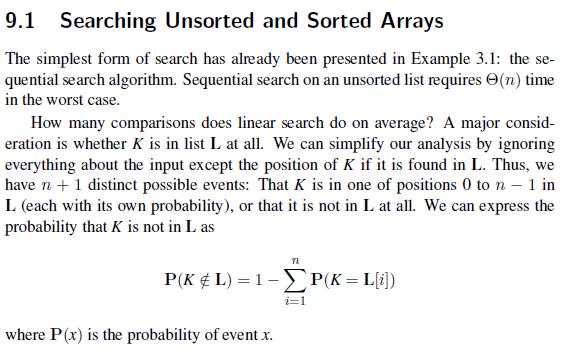
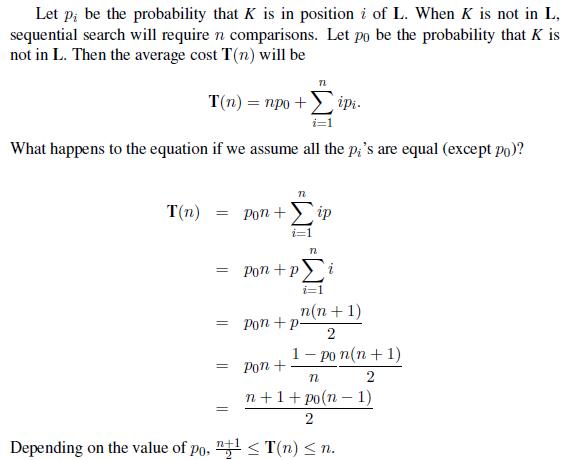
9.1 Searching Unsorted and Sorted Arrays The simplest form of search has already been presented in Example 3.1: the se- quential search algorithm. Sequential search on an unsorted list requires (n) time in the worst case. How many comparisons does linear search do on average? A major consid- eration is whether K is in list L at all. We can simplify our analysis by ignoring everything about the input except the position of K if it is found in L. Thus, we have n + 1 distinct possible events: That K is in one of positions 0 to n - 1 in L (each with its own probability), or that it is not in L at all. We can express the probability that K is not in L as 72 P(KL)=1-P(K = L[i]) where P(x) is the probability of event x. i=1
Step by Step Solution
3.44 Rating (157 Votes )
There are 3 Steps involved in it
To create a graph showing the expected cost versus the probability of an unsuccessful search denoted as p0 when performing a sequential search we can ... View full answer

Get step-by-step solutions from verified subject matter experts