

Question: Given the data in the file Stock Beta.xlsx, estimate the beta (and alpha) for Microsoft (MSFT). Do this for each criterion and each period of
Given the data in the file Stock Beta.xlsx, estimate the beta (and alpha) for Microsoft (MSFT). Do this for each criterion and each period of time to obtain a table analogous to that in the top right of Figure 7.49. What do you conclude about Microsoft?
Figure 7.49:
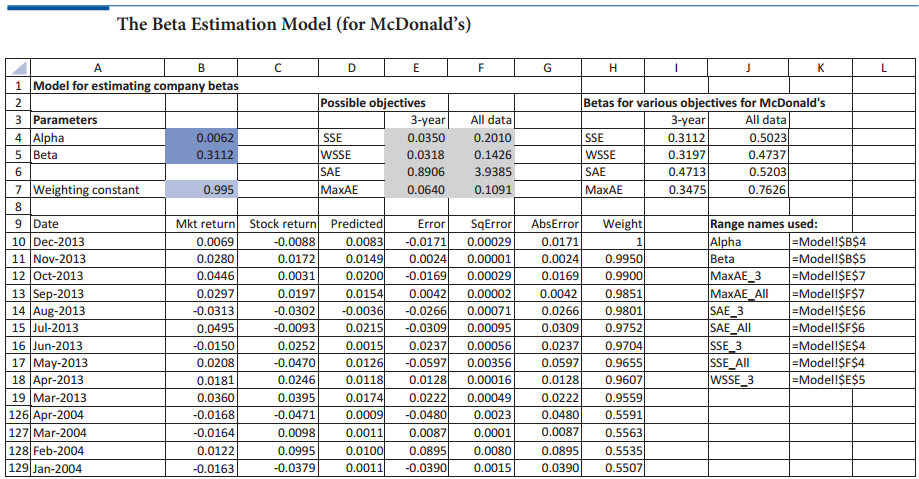
The Beta Estimation Model (for McDonald's) K 1 Model for estimating company betas Possible objectives 3-year Betas for various objectives for McDonald's 2 3 Parameters All data 3-year All data 4 Alpha 5 Beta 0.5023 0.0062 SE 0.0350 0.2010 SSE 0.3112 WSSE SAE MaxAE 0.3112 0.0318 0.1426 WSSE 0.3197 0.4737 0.4713 0.5203 0.7626 0.8906 3.9385 SAE 7 Weighting constant 0.3475 0.995 0.0640 0.1091 8. SqError 0.00029 Weight Mkt return AbsError Range names used: Alpha Beta Date Stock return -0.0088 Predicted Error =Model!$B$4 |=Model!$B$5 =Model!$E$7 |=Model!$F$7 =Model!$E$6 =Model!$F$6 |=Model!$E$4 =Modell$F$4 |=Model!$E$5 0.0083 0.0149 0.0200 0.0154 -0.0036 10 Dec-2013 11 Nov-2013 12 Oct-2013 13 Sep-2013 14 Aug-2013 15 Jul-2013 16 Jun-2013 17 May-2013 18 Apr-2013 0.0069 -0.0171 0.0171 0.9950 0.0024 0.0280 0.0172 0.00001 0.0024 |a_3 |a_All -0.0169 0.0042 -0.0266 -0.0309 0.0446 0.0031 0.00029 0.0169 0.9900 0.0042 0.0297 0.0197 0.00002 0.9851 0.00071 -0.0313 SAE_3 SAE_All -0.0302 0.0266 0.9801 0.0215 0.9752 -0.0093 0.00095 0.0309 0.0495 0.0015 0.0126 0.0118 0.0174 0.0009 0.0011 0.0100 SSE 3 |SSE_All WSSE 3 0.00056 -0.0150 0.0252 0.0237 0.0237 0.9704 -0.0597 0.0128 0.0222 -0.0480 0.9655 0.0208 -0.0470 0.00356 0.0597 0.0181 0.0246 0.00016 0.0128 0.9607 19 Mar-2013 126 Apr-2004 127 Mar-2004 128 Feb-2004 129 Jan-2004 0.0222 0.9559 0.5591 0.5563 0.0395 0.0360 0.00049 0.0023 -0.0168 -0.0471 0.0480 0.0087 0.0087 0.0895 -0.0164 0.0098 0.0001 0.0895 0.0122 0.0995 0.0080 0.5535 0.5507 -0.0379 0.0011 -0.0390 0.0015 0.0390 -0.0163
Step by Step Solution
3.43 Rating (159 Votes )
There are 3 Steps involved in it
Data Monthly closing prices from Jan 2004 to Dec 2013 Month SP 500 AA AAPL AXP BA CAT CSCO CVX DD DIS FDX GE GT HPQ IBM IP JNJ JPM KO MCD MMM MO MRK MSFT PG T UTX WMT Dec2013 181832 994 54902 8757 136... View full answer

Get step-by-step solutions from verified subject matter experts
Document Format (1 attachment)
1497_60470fb8bbdfe_696717.xlsx
300 KBs Excel File