

Question: Now lets analyze the data. a. Calculate the difference (Colors-Words) for each subject and summarize the distribution of differences with a boxplot. Does the graph
Now let’s analyze the data.
a. Calculate the difference (Colors-Words) for each subject and summarize the distribution of differences with a boxplot. Does the graph provide evidence of a difference in the average time required to perform the two tasks? Explain your answer.
b. Explain why it is not safe to use paired t procedures to do inference about the mean difference in time to complete the two tasks.
Does the color in which words are printed affect your ability to read them? Do the words themselves affect your ability to name the color in which they are printed? Mr. Starnes designed a study to investigate these questions using the 16 students in his AP® Statistics class as subjects. Each student performed the following two tasks in random order while a partner timed his or her performance: (1) Read 32 words aloud as quickly as possible, and (2) say the color in which each of 32 words is printed as quickly as possible. Try both tasks for yourself using the word list given.
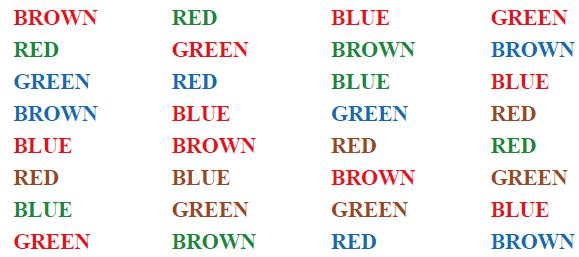
BROWN RED BLUE GREEN RED GREEN BROWN BROWN GREEN RED BLUE BLUE BROWN BLUE GREEN RED BLUE BROWN RED RED RED BLUE BROWN GREEN BLUE GREEN GREEN BLUE GREEN BROWN RED BROWN
Step by Step Solution
3.33 Rating (159 Votes )
There are 3 Steps involved in it
a To calculate the difference ColorsWords for each subject we need to subtract the time it took each ... View full answer

Get step-by-step solutions from verified subject matter experts