

Refer to Exercise 5. Here is computer output from the least-squares regression analysis of the beer and
Question:
Refer to Exercise 5. Here is computer output from the least-squares regression analysis of the beer and blood alcohol data.
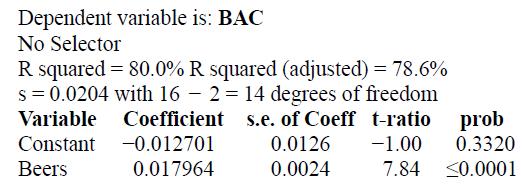
a. What is the estimate for β0? Interpret this value.
b. What is the estimate for β1? Interpret this value.
c. What is the estimate for σ? Interpret this value.
d. Give the standard error of the slope SEb1. Interpret this value.
Exercise 5.
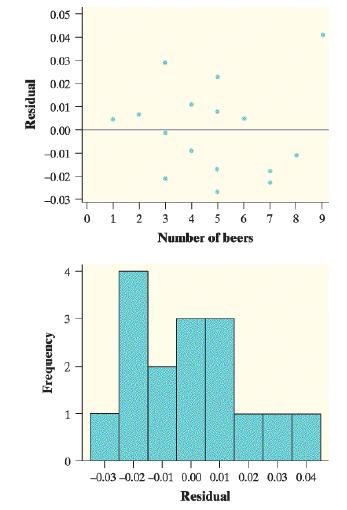
How well does the number of beers a person drinks predict his or her blood alcohol content (BAC)? Sixteen volunteers aged 21 or older with an initial BAC of 0 took part in a study to find out. Each volunteer drank a randomly assigned number of cans of beer. Thirty minutes later, a police officer measured their BAC. A least-squares regression analysis was performed on the data using x = number of beers and y = BAC. Here is a residual plot and a histogram of the residuals. Check whether the conditions for performing inference about the regression model are met.
Step by Step Answer:
aThe value of 0 is 0012701 The blood alcohol content is 0012701 while keeping all f...View the full answer


