

Researchers examined data on the depth of small defects in the Trans-Alaska Oil Pipeline. The researchers compared
Question:
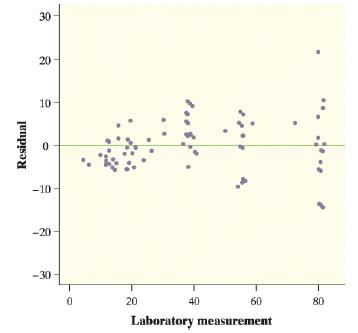
Researchers examined data on the depth of small defects in the Trans-Alaska Oil Pipeline. The researchers compared the results of measurements on 100 defects made in the field with measurements of the same defects made in the laboratory. The figure shows a residual plot for the least-squares regression line based on these data. Explain why the conditions for performing inference about the slope β1 of the population regression line are not met.
Fantastic news! We've Found the answer you've been seeking!
Step by Step Answer:
Inference about the slope 1 of the population regression line requires the following conditions to b...View the full answer

Related Book For 

Question Posted:
