

Question: The Normal probability plot displays data on the areas (in thousands of square miles) of each of the 50 states. Use the graph to determine
The Normal probability plot displays data on the areas (in thousands of square miles) of each of the 50 states. Use the graph to determine if the distribution of land area is approximately Normal.
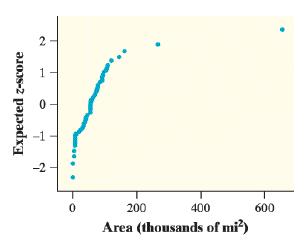
-2 200 400 600 Area (thousands of mi?) Expected z-score 2.
Step by Step Solution
★★★★★
3.39 Rating (152 Votes )
There are 3 Steps involved in it
1 Expert Approved Answer
Step: 1 Unlock

In terms of determining the direction of acceleration three c... View full answer
Question Has Been Solved by an Expert!
Get step-by-step solutions from verified subject matter experts
Step: 2 Unlock
Step: 3 Unlock