

Question: The scatterplot shows the number of books read and the English grade for all 79 students in the study. The least-squares regression line y =
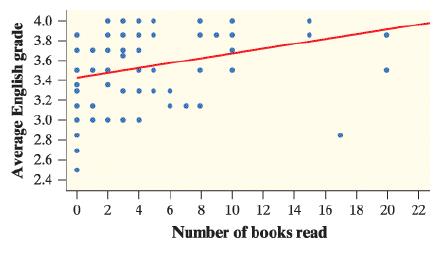
The scatterplot shows the number of books read and the English grade for all 79 students in the study. The least-squares regression line ŷ = 3.42 + 0.024x has been added to the graph.
a. Interpret the slope and y intercept.
b. The student who reported reading 17 books for pleasure had an English GPA of 2.85. Calculate and interpret this student’s residual.
c. For this linear model, r2 = 0.083 Interpret this value.
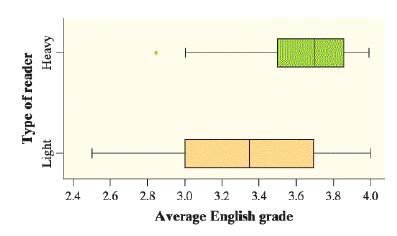
Do students who read more books for pleasure tend to earn higher grades in English? The boxplots show data from a simple random sample of 79 students at a large high school. Students were classified as light readers if they read fewer than 3 books for pleasure per year. Otherwise, they were classified as heavy readers. Each student’s average English grade for the previous two marking periods was converted to a GPA scale, where A = 4.0, A− = 3.7, B+ = 3.3 and so on.
4.0 3.8 3.6 3.4 3.2 3.0 2.8 2.6 2.4 4 6 8 10 12 14 16 18 20 22 Number of books read 2. m m 3m3222 Average English grade
Step by Step Solution
3.31 Rating (166 Votes )
There are 3 Steps involved in it
a The slope of the least squ ares regression line is 0 024 which indicates th... View full answer

Get step-by-step solutions from verified subject matter experts