

Question: The scatterplot shows the relationship between x = temperature in degrees Fahrenheit and y = chirps per minute for the striped ground cricket, along with
The scatterplot shows the relationship between x = temperature in degrees Fahrenheit and y = chirps per minute for the striped ground cricket, along with the regression line ŷ = −0.31+0.212x.
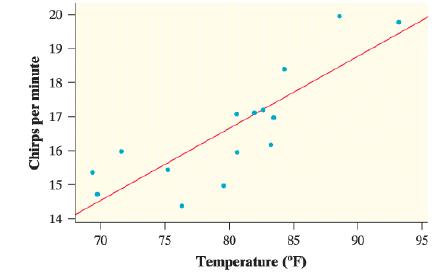
a. Calculate and interpret the residual for the cricket who chirped 20 times per minute when the temperature was 88.6°F.
b. About how many additional chirps per minute do you expect a cricket to make if the temperature increases by 10°F?
20 19 18 - 17 16 15 14 70 75 80 85 90 95 Temperature ("F) Chirps per minute
Step by Step Solution
3.55 Rating (159 Votes )
There are 3 Steps involved in it
y 031 0212 x a Given X 886 So predicted y A y 031 x 021 ... View full answer

Get step-by-step solutions from verified subject matter experts
Document Format (2 attachments)
2048_61d6ac342ccd7_836770.pdf
180 KBs PDF File
2048_61d6ac342ccd7_836770.docx
120 KBs Word File