

The students decided to compare the average ratings of the cafeteria food on the two scales. a.
Question:
The students decided to compare the average ratings of the cafeteria food on the two scales.
a. Find the mean and standard deviation of the ratings for the students who were given the 1-to-5 scale.
b. For the students who were given the 0-to-4 scale, the ratings have a mean of 3.21 and a standard deviation of 0.568. Since the scales differ by one point, the group decided to add 1 to each of these ratings. What are the mean and standard deviation of the adjusted ratings?
c. Would it be appropriate to compare the means from parts (a) and (b) using a two-sample t test? Justify your answer.
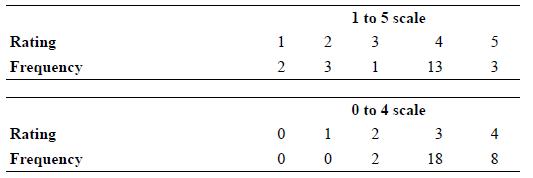
For their final project, a group of AP® Statistics students investigated the following question: “Will changing the rating scale on a survey affect how people answer the question?” To find out, the group took an SRS of 50 students from an alphabetical roster of the school’s just over 1000 students. The first 22 students chosen were asked to rate the cafeteria food on a scale of 1 (terrible) to 5 (excellent). The remaining 28 students were asked to rate the cafeteria food on a scale of 0 (terrible) to 4 (excellent). Here are the data:
Step by Step Answer:
a The mean of the ratings for the students who were given the 1to5 scale can be calculated as barx f...View the full answer


