

Question: The two-way table shows the results of the experiment described in Exercise 27. a. State the appropriate null and alternative hypotheses. b. Show the calculation
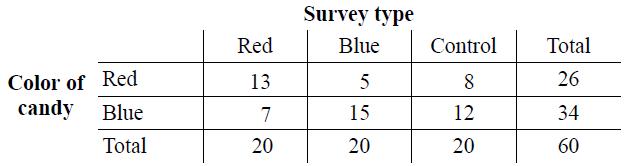
The two-way table shows the results of the experiment described in Exercise 27.
a. State the appropriate null and alternative hypotheses.
b. Show the calculation for the expected count in the Red/Red cell. Then provide a complete table of expected counts.
c. Calculate the value of the chi-square test statistic.
Exercise 27.
Inspired by the example about how background music influences choice of entrée at a restaurant, a statistics student decided to investigate other ways to influence a person’s behavior. Using 60 volunteers, she randomly assigned 20 volunteers to get a “red” survey, 20 volunteers to get a “blue” survey, and 20 volunteers to get a control survey. The first three questions on each survey were the same, but the fourth and fifth questions were different. For example, the fourth question on the “red” survey was “When you think of the color red, what do you think about?” On the blue survey, the question replaced red with blue. On the control survey, the last two questions were not about color. As a reward, each volunteer was allowed to choose a chocolate candy in a red wrapper or a chocolate candy in a blue wrapper. Here are segmented bar graphs showing the results of the experiment. Describe what you see.

Survey type Red Blue Control Total Color of Red candy Blue 13 5 8 26 7 15 12 34 Total 20 20 20 60
Step by Step Solution
3.26 Rating (170 Votes )
There are 3 Steps involved in it
a The appropriate null and alternative hypotheses are Null Hy... View full answer

Get step-by-step solutions from verified subject matter experts