

Question: The graph of the function f is shown in Figure 18. Based on the calculator screen shot, the point (1.333, 5.185) is which of the
The graph of the function f is shown in Figure 18.
Based on the calculator screen shot, the point (1.333, 5.185) is which of the following?
A. a relative (local) maximum of the function
B. the vertex of the function
C. the absolute maximum of the function
D. a zero of the function
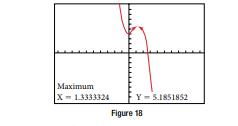
Maximum X= 1.3333324 Y-5.1851852 Figure 18
Step by Step Solution
★★★★★
3.50 Rating (163 Votes )
There are 3 Steps involved in it
1 Expert Approved Answer
Step: 1 Unlock

A a relative local maximum of the function The point 1333 5185 is a relative local ma... View full answer
Question Has Been Solved by an Expert!
Get step-by-step solutions from verified subject matter experts
Step: 2 Unlock
Step: 3 Unlock