

Question: (a) In the interactive figure, a represents the exponent on the factor x 1 in the denominator, while b represents the exponent on the
(a) In the interactive figure, a represents the exponent on the factor x − 1 in the denominator, while b represents the exponent on the factor x + 2 in the denominator. What are the equations of the two vertical asymptotes on the graph of R?
(b) Use the slider to change the value of a to 1 and the value of b to 1. Observe the behavior of the graph of the rational function near each vertical asymptote. Change the value of a to 2. Observe the behavior of the graph of the rational function near the vertical asymptote x = −2. Change the value of b to 2. Observe the behavior of the graph of the rational function near the vertical asymptote x = 1. Continue to experiment with other values of a and b while observing the behavior of the graph of the rational function near each vertical asymptote. Then, answer the following:
(i) If the multiplicity of the zero that gives rise to a vertical asymptote is______ (even/odd), the graph approaches ∞ on one side of the vertical asymptote and approaches −∞ on the other side.
(ii) If the multiplicity of the zero that gives rise to a vertical asymptote is (even/odd), the graph approaches either ∞ or −∞ on both sides of the vertical asymptote.
(c) Consult the figure.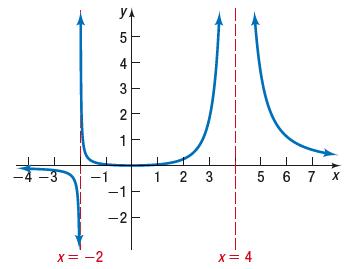
(i) The multiplicity of the zero that gives rise to the vertical asymptote x = −2 is_____ (even/odd).(ii) The multiplicity of the zero that gives rise to the vertical asymptote x = 4 is______ (even/odd).
x=-2 5 4 3 2 1 -1 -2 1 2 3 x=4 L 5 6 7
Step by Step Solution
3.31 Rating (151 Votes )
There are 3 Steps involved in it

Get step-by-step solutions from verified subject matter experts