

Question: a. Show that the graph of ex is concave up over every interval of x-values. b. Show, by reference to the accompanying figure, that if
a. Show that the graph of ex is concave up over every interval of x-values.
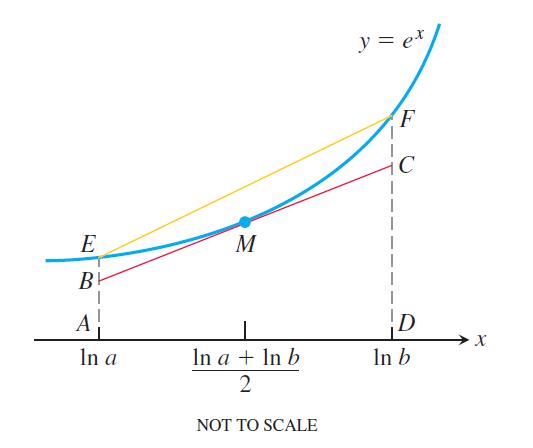
b. Show, by reference to the accompanying figure, that if 0
c. Use the inequality in part (b) to conclude that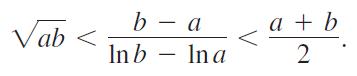
This inequality says that the geometric mean of two positive numbers is less than their logarithmic mean, which in turn is less than their arithmetic mean.
e(Ina+Inb)/2. (Inb - Ina) < < Inb In a et dx < elna + elnb 2 (In b - In a).
Step by Step Solution
3.40 Rating (159 Votes )
There are 3 Steps involved in it
a To show that the graph of ex is concave up over every interval of xvalues we need to show that its ... View full answer

Get step-by-step solutions from verified subject matter experts