

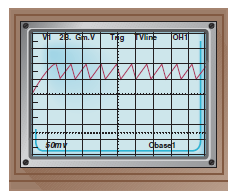
An oscilloscope often displays a sawtooth curve.This curve can be approximated by sinusoidal curves of varying periods
Question:
An oscilloscope often displays a sawtooth curve.This curve can be approximated by sinusoidal curves of varying periods and amplitudes.
(a) Use a graphing utility to graph the following function, which can be used to approximate the sawtooth curve.
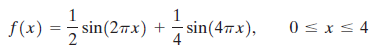
(b) A better approximation to the sawtooth curve is given by
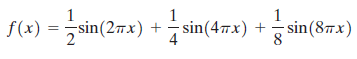
Use a graphing utility to graph this function for 0 ≤ x ≤ 4 and compare the result to the graph obtained in part (a).
(c) A third and even better approximation to the sawtooth curve is given by
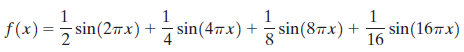
Use a graphing utility to graph this function for 0 ≤ x ≤ 4 and compare the result to the graphs obtained in parts (a) and (b).
(d) What do you think the next approximation to the sawtooth curve is?
Fantastic news! We've Found the answer you've been seeking!
Step by Step Answer:
a b c d ...View the full answer

Answered By
Muhammad Ghyas Asif
It is my obligation to present efficient services to my clients by providing a work of quality, unique, competent and relevant. I hope you have confidence in me and assign me the order and i promise to follow all the instructions and keep time.
109+ Reviews
203+ Question Solved
Related Book For 

Question Posted:
