

Question: Graph y = -2x sin (x 2 ) for -2 x 3. Then, on the same screen, graph for h = 1.0, 0.7,
Graph y = -2x sin (x2) for -2 ≤ x ≤ 3. Then, on the same screen, graph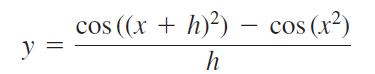
for h = 1.0, 0.7, and 0.3. Experiment with other values of h. What do you see happening as h → 0? Explain this behavior.
y = cos ((x + h)) - cos (x) h
Step by Step Solution
★★★★★
3.44 Rating (179 Votes )
There are 3 Steps involved in it
1 Expert Approved Answer
Step: 1 Unlock

ANSWER Now lets consider what happens as h approaches 0 We can see from the graph that as ... View full answer
Question Has Been Solved by an Expert!
Get step-by-step solutions from verified subject matter experts
Step: 2 Unlock
Step: 3 Unlock