

Question: Graph y = -sin x for- x 2. On the same screen, graph for h = 1, 0.5, 0.3, and 0.1. Then, in
Graph y = -sin x for-π ≤ x ≤ 2π. On the same screen, graph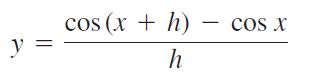
for h = 1, 0.5, 0.3, and 0.1. Then, in a new window, try h = -1, -0.5, and -0.3. What happens as h→ 0+? As h→ 0-? What phenomenon is being illustrated here?
y cos (x + h) h COS X
Step by Step Solution
★★★★★
3.39 Rating (158 Votes )
There are 3 Steps involved in it
1 Expert Approved Answer
Step: 1 Unlock

ANSWE... View full answer
Question Has Been Solved by an Expert!
Get step-by-step solutions from verified subject matter experts
Step: 2 Unlock
Step: 3 Unlock