

Let S represent sales of a new product (in thousands of units), let L represent the maximum
Question:
Let S represent sales of a new product (in thousands of units), let L represent the maximum level of sales (in thousands of units), and let t represent time (in months). The rate of change of S with respect to t is proportional to the product of S and L - S.(a) Write the differential equation for the sales model when L = 100, S = 10 when t = 0, and S = 20 when t = 1. Verify that
![]()
(b) At what time is the growth in sales increasing most rapidly?(c) Use a graphing utility to graph the sales function.(d) Sketch the solution from part (a) on the slope field below. To print an enlarged copy of the graph, go to MathGraphs.com.
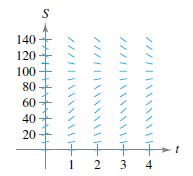
(e) Assume the estimated maximum level of sales is correct. Use the slope field to describe the shape of the solution curves for sales when, at some period of time, sales exceed L.
Step by Step Answer:

This question has not been answered yet.
You can Ask your question!

Calculus Of A Single Variable
ISBN: 9781337275361
11th Edition
Authors: Ron Larson, Bruce H. Edwards
