

Question: On a scale from 0 to 1, the effectiveness E of a pain-killing drug t hours after entering the bloodstream is displayed in the accompanying
On a scale from 0 to 1, the effectiveness E of a pain-killing drug t hours after entering the bloodstream is displayed in the accompanying figure.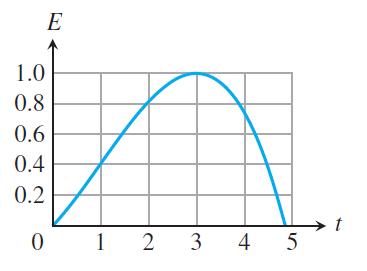
a. At what times does the effectiveness appear to be increasing? What is true about the derivative at those times?
b. At what time would you estimate that the drug reaches its maximum effectiveness? What is true about the derivative at that time? What is true about the derivative as time increases in the 1 hour before your estimated time?
1.0 0.8 0.6 0.4 0.2 E 0 1 2 3 4 5
Step by Step Solution
3.56 Rating (167 Votes )
There are 3 Steps involved in it
From the given graph we can observe that the value of E is increasing from t 0 to t 3 and then decre... View full answer

Get step-by-step solutions from verified subject matter experts