

Outlays for national defense D (in billions of dollars) for 2006 through 2014 are shown in the
Question:
Outlays for national defense D (in billions of dollars) for 2006 through 2014 are shown in the table, where t is the time in years, with t = 6 corresponding to 2006.
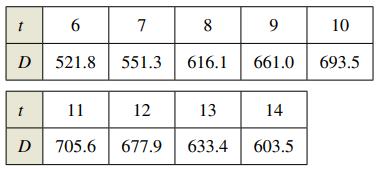
(a) Use the regression capabilities of a graphing utility to find a model of the form D = at4 + bt3 + ct2 + dt + e for the data.
(b) Use a graphing utility to plot the data and graph the model.
(c) For the years shown in the table, when does the model indicate that the outlay for national defense was at a maximum? When was it at a minimum?
(d) For the years shown in the table, when does the model indicate that the outlay for national defense was increasing at the greatest rate?
Fantastic news! We've Found the answer you've been seeking!
Step by Step Answer:
a D 041489t 4 171...View the full answer

Answered By
Sarah Khan
My core expertise are:
-_ Finance
-_ Business
-_ Management
-_ Marketing Management
-_ Financial Management
-_ Corporate Finance
-_ HRM etc...
I have 7+ years of experience as an online tutor. I have hands-on experience in handling:
-_ Academic Papers
-_ Research Paper
-_ Dissertation Paper
-_ Case study analysis
-_ Research Proposals
-_ Business Plan
-_ Complexed financial calculations in excel
-_ Home Work Assistance
-_ PPT
-_ Thesis Paper
-_ Capstone Papers
-_ Essay Writing etc...
91+ Reviews
92+ Question Solved
Related Book For 

Calculus Of A Single Variable
ISBN: 9781337275361
11th Edition
Authors: Ron Larson, Bruce H. Edwards
Question Posted:
