

Question: Shows the graph of a function y = (x). Copy the graph and draw in the line y = x. Then use symmetry with respect
Shows the graph of a function y = ƒ(x). Copy the graph and draw in the line y = x. Then use symmetry with respect to the line y = x to add the graph of ƒ-1 to your sketch. (It is not necessary to find a formula for ƒ -1.) Identify the domain and range of ƒ-1.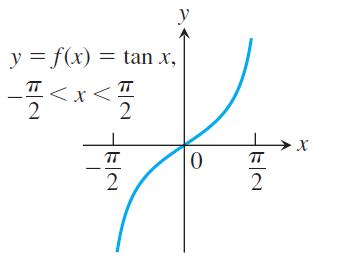
y = f(x) = tan X, -
Step by Step Solution
★★★★★
3.39 Rating (168 Votes )
There are 3 Steps involved in it
1 Expert Approved Answer
Step: 1 Unlock

To graph the function y tanx we can use the following steps Plot the ... View full answer
Question Has Been Solved by an Expert!
Get step-by-step solutions from verified subject matter experts
Step: 2 Unlock
Step: 3 Unlock