

Question: The figure shows a graph of r as a function of in Cartesian coordinates. Use it to sketch the corresponding polar curve. 2-
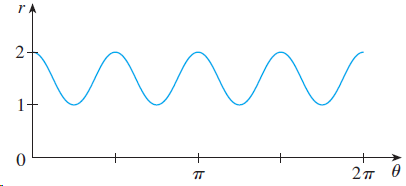
The figure shows a graph of r as a function of θ in Cartesian coordinates. Use it to sketch the corresponding polar curve.
2-
Step by Step Solution
★★★★★
3.38 Rating (173 Votes )
There are 3 Steps involved in it
1 Expert Approved Answer
Step: 1 Unlock

The given graph has a maximum ... View full answer
Question Has Been Solved by an Expert!
Get step-by-step solutions from verified subject matter experts
Step: 2 Unlock
Step: 3 Unlock