The figure shows the graphs of f , f, and f. Identify each curve, and explain your
Question:
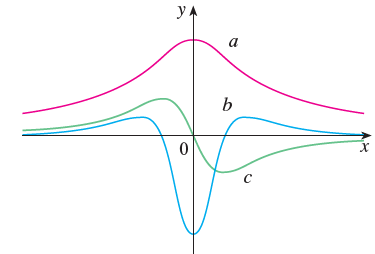
The figure shows the graphs of f , f′, and f′′. Identify each curve, and explain your choices.
Transcribed Image Text:
УА х
Fantastic news! We've Found the answer you've been seeking!
Step by Step Answer:
Answer rating: 75% (12 reviews)
The graph of a has tangent lines with positive slope for x 0 ...View the full answer
Answered By
Utsab mitra
I have the expertise to deliver these subjects to college and higher-level students. The services would involve only solving assignments, homework help, and others.
I have experience in delivering these subjects for the last 6 years on a freelancing basis in different companies around the globe. I am CMA certified and CGMA UK. I have professional experience of 18 years in the industry involved in the manufacturing company and IT implementation experience of over 12 years.
I have delivered this help to students effortlessly, which is essential to give the students a good grade in their studies.
3.50+
2+ Reviews
10+ Question Solved
Related Book For
Question Posted:
Students also viewed these Mathematics questions
-
The figure shows the graphs of f, f, and f". Identify each curve, and explain your choices. y
-
The figure shows the graphs of f, f, and f. Identify each curve, and explain your choices. a b.
-
The figure shows the graphs of f, f and ∫x f (t) dt. Identify each graph, and explain your choices. b
-
Mrs. Ridhima had a factory situated in Delhi which he transferred to Uttar Pradesh and closed all operations in Delhi. Whether it will constitute a slump sale and whether it is liable to tax under...
-
Best Engine reconditions engines. Its job cost records yield the following information. Best Engine uses a perpetual inventory system. Requirements 1. Compute Best Engine's cost of (a) Work in...
-
Consider the proportion of Americans under the age of 18 living below the poverty level for each of the years 1959 through 1996. The data are in the file P2_29.XLS. a. In which years of the sample...
-
A car initially traveling with velocity \(\vec{v}\), slows down at constant acceleration and stops. (a) Sketch a graph of \(v_{x}(x)\), the car's \(x\) component of velocity as a function of...
-
Zelmer Company manufactures tablecloths. Sales have grown rapidly over the past 2 years. As a result, the president has installed a budgetary control system for 2012. The following data were used in...
-
How to go about measuring the effectiveness of the services offered, what evidence-based tools should be used (2-3 tools), and why?
-
Exhibit 10.4 presents a partial balance sheet for HP3, a creator and manufacturer of computer hardware and software and related services, for its fiscal years ending October 31, 2012 and 2013. a. HP3...
-
Determine whether the statement is true or false. If it is true, explain why. If it is false, explain why or give an example that disproves the statement. An equation of the tangent line to the...
-
Sketch the graph of a function f that satisfies all of the following conditions: The domain of f is all real numbers except 0, for all x in the domain of lim f(x) = 1, lim f(x) = 0, f'(x) > 0 f, lim...
-
Assume a hurricane devastated an island economy that produced only coconuts and bamboo. Demonstrate this event on the islands PPC.
-
The African Economic Outlook (2021) outlines Africa's growth performance and outlook amid the Covid-19 pandemic. Discuss the macroeconomic performance and prospects; macroeconomic environment and...
-
The table below shows the closing monthly stock prices for IBM and Amazon. Calculate the exponential three-month moving average for both stocks where two-thirds of the average weight is placed on the...
-
How can your instructor expect you to figure out nursing diagnoses before you even see the patient or talk with him? 3. How does knowing the patient's medical diagnoses help you determine possible...
-
Determine the deflection at point C of the beam as shown. EI is constant. Note: tc/B is the moment of the M/El diagram between C and B about the point C. 10m B 60 kN 5 m
-
c. Intergenerational inequality and inequality in earnings between members of a population are positively correlated. Discuss two reasons that may explain this positive correlation. [max words: 250]...
-
Given the Expenditure Side of Aggregate Output in the Economy: Personal Consumption $200 Government Purchases 50 Gross Private Investment 40 Exports 30 Imports 40 a) Calculate the Gross Domestic...
-
Open Text Corporation provides a suite of business information software products. Exhibit 10-9 contains Note 10 from the companys 2013 annual report detailing long-term debt. Required: a. Open Text...
-
Find the area bounded by the curves y = cox x and y = cos2x between x = 0 and x = .
-
The region under the curve y = cos2x, 0 x /2, is rotated about the x-axis. Find the volume of the resulting solid.
-
The region under the curve y = cos2x, 0 x /2, is rotated about the x-axis. Find the volume of the resulting solid.
-
What are the key segments in the premium dog market? What key characteristics do customers in the premium dog segment share? How does this influence their buying process for their dogs? Explain the...
-
I have seen an example of an emerging approach that has been successful in the commercial world. Competition from other businesses operating in the same industry was fierce for the company I worked...
-
give me some Marketing strategies for a Trade School to Engage Students How make those strategies works? Also, ideas to Recruit Students for Trade School with Modern Marketing Tactics
Study smarter with the SolutionInn App