

The following data represent the percent of all drivers by age who have been stopped by the
Question:
The following data represent the percent of all drivers by age who have been stopped by the police for any reason within the past year. The median age represents the midpoint of the upper and lower limit for the age range.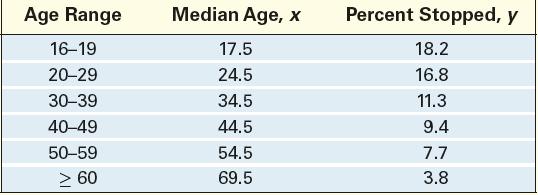
(a) Using a graphing utility, draw a scatter plot of the data treating median age, x, as the independent variable.
(b) Determine a model that best describes the relation between median age and percent stopped. You may choose from among linear, quadratic, cubic, exponential, logarithmic, and logistic models.
(c) Provide a justification for the model that you selected in part (b).
Step by Step Answer:

This question has not been answered yet.
You can Ask your question!
Related Book For 

Precalculus Concepts Through Functions A Unit Circle Approach To Trigonometry
ISBN: 9780137945139
5th Edition
Authors: Michael Sullivan
Question Posted:
