

The following data represent the percentages of U.S. advertising spending for Internet ads, n, and magazine ads,
Question:
The following data represent the percentages of U.S. advertising spending for Internet ads, n, and magazine ads, m, over time.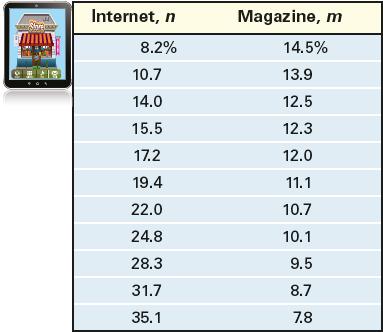
(a) Draw a scatter plot of the data, treating percentage of spending on Internet ads as the independent variable. Does the relation appear to be linear?
(b) Use a graphing utility to find the line of best fit that models the relation between the percentages of spending on Internet ads and magazine ads. Express the model using function notation.
(c) What is the correlation coefficient? Does the correlation coefficient support your conclusion from part (a)?
(d) Interpret the slope of the line of best fit.
(e) What is the domain of the function?
(f) Predict the percentage of spending on magazine ads when Internet ads account for 26.0% of ad spending.
Step by Step Answer:

This question has not been answered yet.
You can Ask your question!


Precalculus Concepts Through Functions A Unit Circle Approach To Trigonometry
ISBN: 9780137945139
5th Edition
Authors: Michael Sullivan
