

Question: The following data represent the price p and quantity demanded per day q of 24-in. OLED monitors. (a) Plot the ordered pairs (p, q) in
The following data represent the price p and quantity demanded per day q of 24-in. OLED monitors.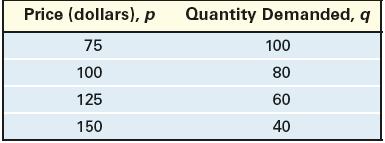
(a) Plot the ordered pairs (p, q) in a Cartesian plane.
(b) Show that quantity demanded q is a linear function of price p.
(c) Determine the linear function that describes the relation between p and q.
(d) What is the implied domain of the linear function?
(e) Graph the linear function in the Cartesian plane drawn in part (a).
(f) Interpret the slope.
(g) Interpret the values of the intercepts.
Price (dollars), p Quantity Demanded, q 75 100 125 150 100 80 60 40
Step by Step Solution
★★★★★
3.54 Rating (164 Votes )
There are 3 Steps involved in it
1 Expert Approved Answer
Step: 1 Unlock

Question Has Been Solved by an Expert!
Get step-by-step solutions from verified subject matter experts
Step: 2 Unlock
Step: 3 Unlock