

The graph in the accompanying figure shows the average annual percentage change y = (t) in the
Question:
The graph in the accompanying figure shows the average annual percentage change y = ƒ(t) in the U.S. gross national product (GNP) for the years 2005–2011. Graph dy/dt (where defined).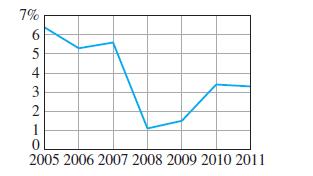
Fantastic news! We've Found the answer you've been seeking!
Step by Step Answer:
y 2 1 0 ...View the full answer

Answered By
Jehal Shah
I believe everyone should try to be strong at logic and have good reading habit. Because If you possess these two skills, no matter what difficult situation is, you will definitely find a perfect solution out of it. While logical ability gives you to understand complex problems and concepts quite easily, reading habit gives you an open mind and holistic approach to see much bigger picture.
So guys, I always try to explain any concept keeping these two points in my mind. So that you will never forget any more importantly get bored.
Last but not the least, I am finance enthusiast. Big fan of Warren buffet for long term focus investing approach. On the same side derivatives is the segment I possess expertise.
If you have any finacne related doubt, do reach me out.
1+ Reviews
10+ Question Solved
Related Book For 
Thomas Calculus Early Transcendentals
ISBN: 9780321884077
13th Edition
Authors: Joel R Hass, Christopher E Heil, Maurice D Weir
Question Posted:
