

Question: The graph of a function t is shown. (a) Verify that t satisfies the hypotheses of the Mean Value Theorem on the interval [0, 8].
The graph of a function t is shown.
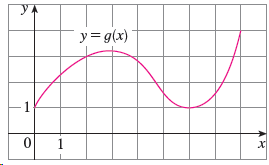
(a) Verify that t satisfies the hypotheses of the Mean Value Theorem on the interval [0, 8].
(b) Estimate the value(s) of c that satisfy the conclusion of the Mean Value Theorem on the interval [0, 8].
(c) Estimate the value(s) of c that satisfy the conclusion of the Mean Value Theorem on the interval [2, 6].
y= g(x) 1
Step by Step Solution
★★★★★
3.26 Rating (167 Votes )
There are 3 Steps involved in it
1 Expert Approved Answer
Step: 1 Unlock

a 1 g is continuous on t... View full answer
Question Has Been Solved by an Expert!
Get step-by-step solutions from verified subject matter experts
Step: 2 Unlock
Step: 3 Unlock