

The graph of f is shown in the figure. (a) For which values of x is f(x)
Question:
The graph of f is shown in the figure.
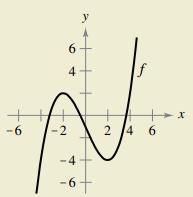
(a) For which values of x is f′(x) zero? Positive? Negative? What do these values mean?
(b) For which values of x is f″(x) zero? Positive? Negative? What do these values mean?
(c) On what open interval is f′ an increasing function?
(d) For which value of x is f′(x) minimum? For this value of x, how does the rate of change of f compare with the rates of change of f for other values of x? Explain.
Fantastic news! We've Found the answer you've been seeking!
Step by Step Answer:
I can assist with the analysis of the graph but since the image resolution is a bit low Ill make som...View the full answer

Answered By
Ehsan Mahmood
I’ve earned Masters Degree in Business Studies and specialized in Accounts & Finance. Couple with this, I have earned BS Sociology from renowned institute of Pakistan. Moreover, I have humongous teaching experience at Graduate and Post-graduate level to Business and humanities students along with more than 7 years of teaching experience to my foreign students Online. I’m also professional writer and write for numerous academic journals pertaining to educational institutes periodically.
248+ Reviews
287+ Question Solved
Related Book For 

Calculus Of A Single Variable
ISBN: 9781337275361
11th Edition
Authors: Ron Larson, Bruce H. Edwards
Question Posted:
