

Question: The graph of f(x) = x + 1 is shown in the figure. Find such that if 0 < x 2 < , then
The graph of f(x) = x + 1 is shown in the figure. Find such that if 0
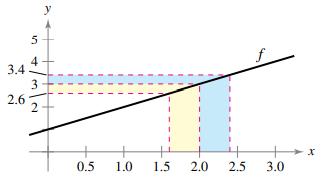
3.4 2.6 5 ++ 4 3 2 y 0.5 1.0 1.5 2.0 2.5 3.0 X
Step by Step Solution
★★★★★
3.40 Rating (166 Votes )
There are 3 Steps involved in it
1 Expert Approved Answer
Step: 1 Unlock

To solve this problem we need to first understand what the inequality x 2 means This ... View full answer
Question Has Been Solved by an Expert!
Get step-by-step solutions from verified subject matter experts
Step: 2 Unlock
Step: 3 Unlock