

Question: The table lists the approximate values V of a mid-sized sedan for the years 2010 through 2016. The variable t represents the time (in years),
The table lists the approximate values V of a mid-sized sedan for the years 2010 through 2016. The variable t represents the time (in years), with t = 10 corresponding to 2010.
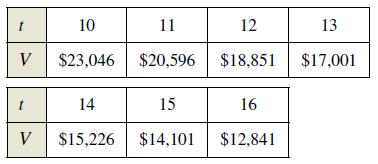
(a) Use the regression capabilities of a graphing utility to fit linear and quadratic models to the data. Plot the data and graph the models.(b) What does the slope represent in the linear model in part (a)?(c) Use the regression capabilities of a graphing utility to fit an exponential model to the data.(d) Determine the horizontal asymptote of the exponential model found in part (c). Interpret its meaning in the context of the problem.(e) Use the exponential model to find the rates of decrease in the value of the sedan when t = 12 and t = 15.
10 V $23,046 t 14 V $15,226 + 11 $20,596 15 $14,101 12 $18,851 16 $12,841 13 $17,001
Step by Step Solution
3.48 Rating (151 Votes )
There are 3 Steps involved in it
a Using a graphing utility to fit linear and quadratic models to the data we get Linear model V 1574... View full answer

Get step-by-step solutions from verified subject matter experts