

Question: The table shows the temperatures T (in degrees Fahrenheit) at which water boils at selected pressures p (in pounds per square inch). A model that
The table shows the temperatures T (in degrees Fahrenheit) at which water boils at selected pressures p (in pounds per square inch).
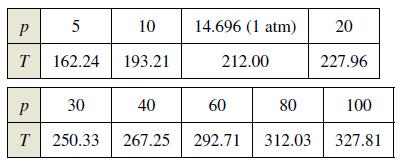
A model that approximates the data is T = 87.97 + 34.96 ln p + 7.91√p.
(a) Use a graphing utility to plot the data and graph the model.(b) Find the rates of change of T with respect to p when p = 10 and p = 70.(c) Use a graphing utility to graph T'. Find lim p∞ T'(p) and interpret the result in the context of the problem.
P 5 T 162.24 P T 30 250.33 10 193.21 14.696 (1 atm) 212.00 40 60 80 267.25 292.71 312.03 20 227.96 100 327.81
Step by Step Solution
3.44 Rating (151 Votes )
There are 3 Steps involved in it
a b T10 475... View full answer

Get step-by-step solutions from verified subject matter experts