

Use the graph of f shown in the figure to answer the following. (a) Using the interval
Question:
Use the graph of f shown in the figure to answer the following.
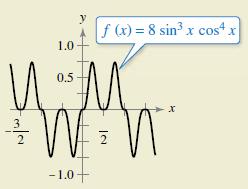
(a) Using the interval shown in the graph, approximate the value(s) of x where f is maximum. Explain.(b) Using the interval shown in the graph, approximate the value(s) of x where f is minimum. Explain.
Fantastic news! We've Found the answer you've been seeking!
Step by Step Answer:
The given function is fx 8sin3xcos4x To determine the maximum and minimum values of f within the given interval we need to analyze the behavior of the ...View the full answer

Answered By
User l_917591
As a Business Management graduate from Moi University, I had the opportunity to work as a tutor for undergraduate students in the same field. This experience allowed me to apply the theoretical knowledge I had gained in a practical setting, while also honing my teaching and communication skills.
As a tutor, I was responsible for conducting tutorial sessions, grading assignments and exams, and providing feedback and support to my students. I also assisted with the preparation of course materials and collaborated with other tutors and professors to ensure consistency in teaching and assessment.
0 Reviews
10+ Question Solved
Related Book For 
Calculus Of A Single Variable
ISBN: 9781337275361
11th Edition
Authors: Ron Larson, Bruce H. Edwards
Question Posted:
