

Question: 2. The table below shows the predictions made for a continuous target feature by two different prediction models for a test dataset. a. Based on
2. The table below shows the predictions made for a continuous target feature by two different prediction models for a test dataset.
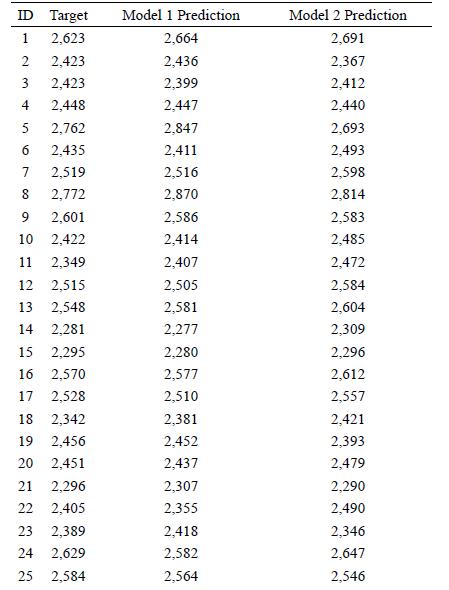
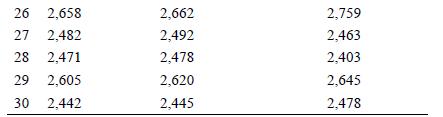
a. Based on these predictions, calculate the evaluation measures listed below for each model.
i. The sum of squared errors ii. The R2 measure
b. Based on the evaluation measures calculated, which model do you think is performing better for this dataset?
ID Target Model 1 Prediction Model 2 Prediction 1 2,623 2,664 2,691 2 2,423 2,436 2,367 3 2,423 2,399 2,412 4 2,448 2,447 2,440 5 2,762 2,847 2,693 6 2,435 2,411 2,493 7 2,519 2,516 2,598 8 2,772 2,870 2,814 9 2,601 2,586 2,583 10 2,422 2,414 2,485 11 2,349 2,407 2,472 12 2,515 2,505 2,584 13 2,548 2,581 2,604 14 2,281 2,277 2,309 15 2,295 2,280 2,296 16 2,570 2,577 2,612 17 2,528 2,510 2,557 18 2,342 2,381 2,421 19 2,456 2,452 2,393 20 2,451 2,437 2,479 21 2,296 2,307 2,290 22 2,405 2,355 2,490 23 2,389 2,418 2,346 24 2,629 2,582 2,647 25 2,584 2,564 2,546
Step by Step Solution
There are 3 Steps involved in it

Get step-by-step solutions from verified subject matter experts