

Assume that the Fourier transform of x(t) is real and has the shape shown in Figure 2.43.
Question:
Assume that the Fourier transform of x(t) is real and has the shape shown in Figure 2.43. Determine and plot the spectrum of each of the following signals:
(a) 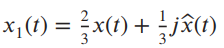
(b)
![]()
(c) ![]()
(d) ![]()
Fantastic news! We've Found the answer you've been seeking!
Step by Step Answer:
a Note that F jxt j jsgn f X f Hence b It follows ...View the full answer

Answered By
YOGENDRA NAILWAL
As I'm a Ph.D. student, so I'm more focussed on my chemistry laboratory. I have qualified two national level exams viz, GATE, and NET JRF (Rank 68). So I'm highly qualified in chemistry subject. Also, I have two years of teaching experience in this subject, which includes college teacher as well as a personal tutor. I can assure you if you hire me on this particular subject, you are never going to regret it.
Best Regards.
1+ Reviews
10+ Question Solved
Related Book For 

Principles of Communications Systems, Modulation and Noise
ISBN: 978-8126556793
7th edition
Authors: Rodger E. Ziemer, William H. Tranter
Question Posted:
