

Question: Execute the computer program used to generate the FM discriminator performance characteristics illustrated in Figure 8.14. Add to the performance curves for β = 1,
threshold effect more or less pronounced? Why?
Figure 8.14
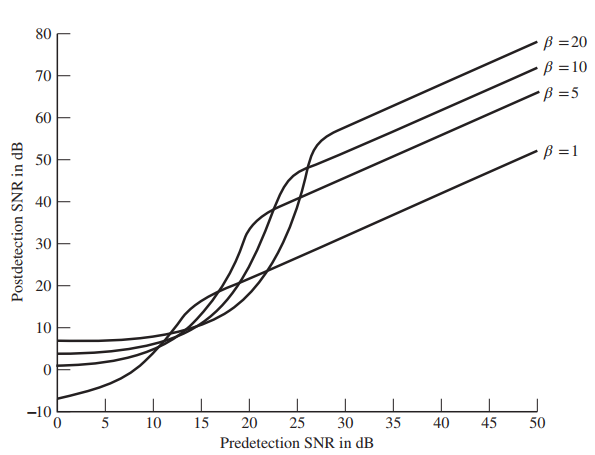
=20 =10 B =5 70 60 =1 50 40 30 20 10 -10 45 5 10 15 20 25 30 35 40 50 Predetection SNR in dB Postdetection SNR in dB 80
Step by Step Solution
★★★★★
3.53 Rating (167 Votes )
There are 3 Steps involved in it
1 Expert Approved Answer
Step: 1 Unlock

The MATLAB program for solving this computer exercise follows File ce82m zdB 050 predetect... View full answer
Question Has Been Solved by an Expert!
Get step-by-step solutions from verified subject matter experts
Step: 2 Unlock
Step: 3 Unlock