

Question: Plot the results for P E given in Table 9.2 versus z = E b / N 0 in decibels with P E plotted on
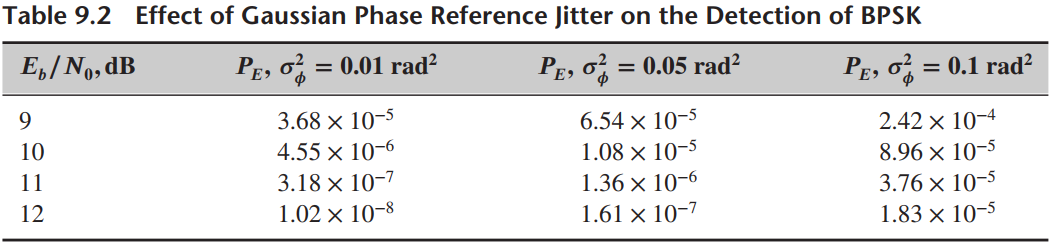
Table 9.2 Effect of Gaussian Phase Reference Jitter on the Detection of BPSK Pe, o Pe, o = 0.1 rad? PE, o = 0.01 rad? E/ No, dB = 0.05 rad? 6.54 x 10⁻⁵ 1.08 10-5 1.36 10-6 2.42 x 10⁻⁴ 8.96 10-5 3.76 10-5 1.83 x 10⁻⁵ 3.68 10-5 4.55 x 10⁻⁶ 3.18 10-7 1.02 10-8 10 11 1.61 10-7 12
Step by Step Solution
★★★★★
3.33 Rating (171 Votes )
There are 3 Steps involved in it
1 Expert Approved Answer
Step: 1 Unlock

Numerical integration of 983 with 981 and 982 substituted shows that th... View full answer
Question Has Been Solved by an Expert!
Get step-by-step solutions from verified subject matter experts
Step: 2 Unlock
Step: 3 Unlock