See Table 2.5 showing financial statement data and stock price data for Mydeco Corp. a. Compute Mydecos
Question:
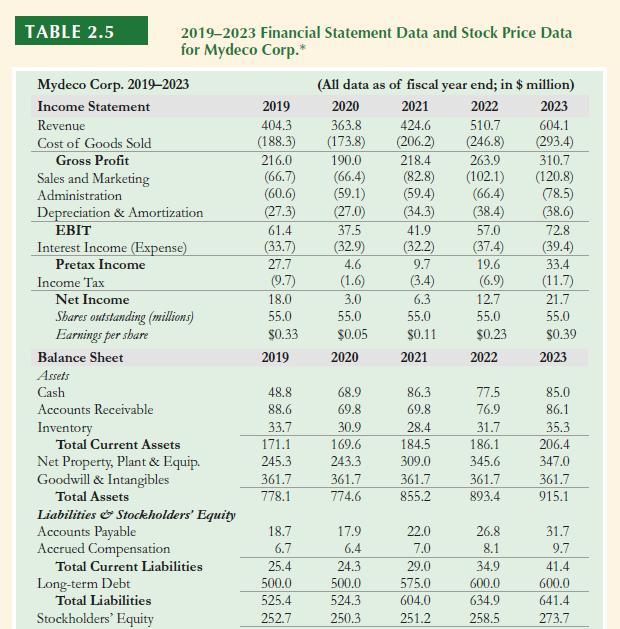
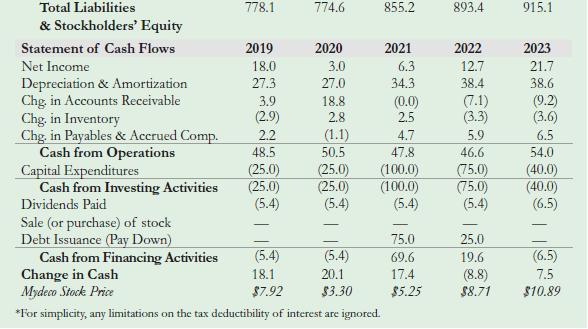
See Table 2.5 showing financial statement data and stock price data for Mydeco Corp.


a. Compute Mydeco’s PE ratio each year from 2019 to 2023. In which year was it the highest?
b. What was Mydeco’s Enterprise Value to EBITDA ratio each year? In which year was it the highest?
c. What might explain the differing time pattern of the two valuation ratios?
Transcribed Image Text:
TABLE 2.5 2019-2023 Financial Statement Data and Stock Price Data for Mydeco Corp.* (All data as of fiscal year end; in $ million) Mydeco Corp. 2019-2023 Income Statement 2019 2020 2021 2022 2023 Revenue 404.3 363.8 424.6 510.7 604.1 Cost of Goods Sold (188.3) (173.8) (206.2) (246.8) (293.4) Gross Profit 216.0 190.0 218.4 263.9 310.7 Sales and Marketing (66.7) (66.4) (82.8) (102.1) (120.8) Administration (60.6) (59.1) (59.4) (66.4) (78.5) Depreciation & Amortization (27.3) (27.0) (34.3) (38.4) (38.6) EBIT 61.4 37.5 41.9 57.0 72.8 Interest Income (Expense) (33.7) (32.9) (32.2) (37.4) (39.4) Pretax Income 27.7 4.6 9.7 19.6 33.4 Income Tax (9.7) (1.6) (3.4) (6.9) (11.7) Net Income 18.0 3.0 6.3 12.7 21.7 Shares outstanding (millions) 55.0 55.0 55.0 55.0 55.0 Earnings per share $0.33 $0.05 $0.11 $0.23 $0.39 Balance Sheet 2019 2020 2021 2022 2023 Assets Cash 48.8 68.9 86.3 77.5 85.0 Accounts Receivable 88.6 69.8 69.8 76.9 86.1 Inventory 33.7 30.9 28.4 31.7 35.3 Total Current Assets 171.1 169.6 184.5 186.1 206.4 Net Property, Plant & Equip. 245.3 243.3 309.0 345.6 347.0 Goodwill & Intangibles 361.7 361.7 361.7 361.7 361.7 Total Assets 778.1 774.6 855.2 893.4 915.1 Liabilities & Stockholders' Equity Accounts Payable 18.7 17.9 22.0 26.8 31.7 Accrued Compensation 6.7 6.4 7.0 8.1 9.7 Total Current Liabilities 25.4 24.3 29.0 34.9 41.4 Long-term Debt 500.0 500.0 575.0 600.0 600.0 Total Liabilities 525.4 524.3 604.0 634.9 641.4 Stockholders' Equity 252.7 250.3 251.2 258.5 273.7
Fantastic news! We've Found the answer you've been seeking!
Step by Step Answer:
Answer rating: 100% (QA)

Answered By

JAPHETH KOGEI
Hi there. I'm here to assist you to score the highest marks on your assignments and homework. My areas of specialisation are:
Auditing, Financial Accounting, Macroeconomics, Monetary-economics, Business-administration, Advanced-accounting, Corporate Finance, Professional-accounting-ethics, Corporate governance, Financial-risk-analysis, Financial-budgeting, Corporate-social-responsibility, Statistics, Business management, logic, Critical thinking,
So, I look forward to helping you solve your academic problem.
I enjoy teaching and tutoring university and high school students. During my free time, I also read books on motivation, leadership, comedy, emotional intelligence, critical thinking, nature, human nature, innovation, persuasion, performance, negotiations, goals, power, time management, wealth, debates, sales, and finance. Additionally, I am a panellist on an FM radio program on Sunday mornings where we discuss current affairs.
I travel three times a year either to the USA, Europe and around Africa.
As a university student in the USA, I enjoyed interacting with people from different cultures and ethnic groups. Together with friends, we travelled widely in the USA and in Europe (UK, France, Denmark, Germany, Turkey, etc).
So, I look forward to tutoring you. I believe that it will be exciting to meet them.
3.00+
2+ Reviews
10+ Question Solved
Related Book For 

Question Posted:
Students also viewed these Business questions
-
See Table 2.5 showing financial statement data and stock price data for Mydeco Corp. a. Compute Mydecos PE ratio each year from 2009 to 2013. In which year was it the highest? b. What was Mydecos...
-
See Table 2.5 showing financial statement data and stock price data for Mydeco Corp. a. Compute Mydeco's PE ratio each year from 2012 to 2016. In which year was it the highest? b. What was Mydeco's...
-
a) What is the floating-point representation of 7.0625 in the standard of IEEE 754? Give the explanation. b) What is the fixed-point representation of 7.0625 in the 2's complement notation? Give the...
-
Evaluate the limit or determine that it does not exist. |xx| lim (x,y)(0,0) [x] + [yl
-
Thomas Wong, accountant for APB Bikes Ltd., was injured in a biking accident. Another employee prepared the income statement shown on the next page for the fiscal year ended September 30, 2017. The...
-
Prepare general journal entries to record the transactions below for Dexter Company by using the following accounts: Cash; Accounts Receivable; Office Supplies; Office Equipment; Accounts Payable; M....
-
X rays with a wavelength of \(0.12 \mathrm{~nm}\) undergo first-order diffraction from a crystal at a \(68^{\circ}\) angle of incidence. What is the angle of second-order diffraction?
-
What are the three types of endowments? How are they presented on the nancial statements of a public and a private college and university? Why are board-designated (or quasi) endowments always...
-
This program almost works perfectly but currently still has an issue. The goal is to have an input file, which is a list of groceries. C++ and Python work together here to achieve three specific...
-
In early 2018, United Airlines (UAL) had a market capitalization of \($25.14\) billion, debt of \($12.73\) billion, and cash of \($5.59\) billion. United also had annual revenues of \($38.72\)...
-
See Table 2.5 showing financial statement data and stock price data for Mydeco Corp. a. How did Mydecos book debt-equity ratio change from 2019 to 2023? b. How did Mydecos market debt-equity ratio...
-
Fill in the blanks with an appropriate word, phrase, or symbol(s). Because it deals with bending and stretching of geometric figures, topology is sometimes referred to as _________ sheet geometry.
-
Sam Martinez is seeking to invest a portion of his considerable assets in the "independent" electric power production industry in California, a sector projected to experience very rapid growth in the...
-
Explain the different alternatives for short term financing and the criteria applied in the selection process?
-
what ways do disturbances, such as natural disasters or anthropogenic activities, perturb the equilibrium of ecosystems, and what are the long-term implications for ecosystem structure and function?
-
what ways does the study of phenotypes inform our understanding of complex biological phenomena, including disease susceptibility, ecosystem dynamics, and evolutionary processes, providing insights...
-
Examine the VACf. What does that statistic tell you about the forecasted variance for the project at completion? Will the project end up over budget or under budget? Are there any activities along...
-
The basic barometer can be used as an altitude measuring device in airplanes. The ground control reports a barometric reading of 753 mm Hg while the pilots reading is 690 mm Hg. Estimate the altitude...
-
You are standing on the top of a building and throw a ball vertically upward. After 2 seconds, the ball passes you on the way down, and 2 seconds after that, it hits the ground below. a. What is the...
-
what ways do chromosomal abnormalities, such as chromosomal mosaicism, ring chromosomes, and marker chromosomes, challenge our understanding of chromosomal biology, genetic diagnosis, and...
-
For growing numbers of students, college is not just time of learning, partying and growing into young adulthood; it is fast becoming a place for building a business. More than 3,000 colleges and...
-
Assume that you are a consultant to assess the potential for the location decision. Please provide your answer to the following questions: 1. What are the two key criteria for Amazon to choose the...

Study smarter with the SolutionInn App


