

A firm wishes to estimate graphically the betas for two assets, A and B. It has gathered
Question:
A firm wishes to estimate graphically the betas for two assets, A and B. It has gathered the return data shown in the following table for the market portfolio and for both assets over the past 10 years, 2009–2018.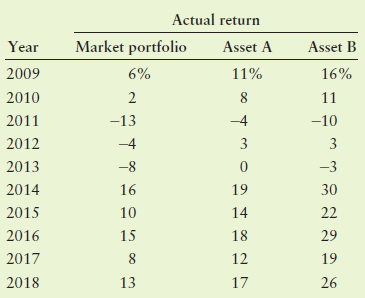
a. On a set of “market return (x-axis)–asset return (y-axis)” axes, use the data given to draw the characteristic line for asset A and for asset B.
b. Use the characteristic lines from part a to estimate the betas for assets A and B.
c. Use the betas found in part b to comment on the relative risks of assets A and B.
Fantastic news! We've Found the answer you've been seeking!
Step by Step Answer:
a b The betas for assets A and B are the slopes of the characteristic lines abov...View the full answer

Answered By
Utsab mitra
I have the expertise to deliver these subjects to college and higher-level students. The services would involve only solving assignments, homework help, and others.
I have experience in delivering these subjects for the last 6 years on a freelancing basis in different companies around the globe. I am CMA certified and CGMA UK. I have professional experience of 18 years in the industry involved in the manufacturing company and IT implementation experience of over 12 years.
I have delivered this help to students effortlessly, which is essential to give the students a good grade in their studies.
2+ Reviews
10+ Question Solved
Related Book For 

Principles of Managerial Finance
ISBN: 978-0134476315
15th edition
Authors: Chad J. Zutter, Scott B. Smart
Question Posted:
