

The table below shows 2016 total revenues, cost of goods sold, earnings available for common stockholders, total
Question:
The table below shows 2016 total revenues, cost of goods sold, earnings available for common stockholders, total assets, and stockholders’ equity for three companies competing in the bottled drinks market: The Coca-Cola Company, Pepsico Inc., and Dr Pepper Snapple Group. All dollar values are in thousands.
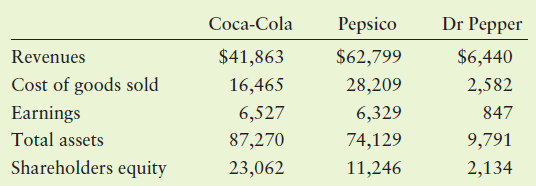
a. Use the information given to analyze each firm’s profitability in as many different ways as you can. Which company is most profitable? Why is this question difficult to answer?
b. For each company, ROE > ROA. Why is that so? Look at the difference between ROE and ROA for each company. Does that difference help you determine which firm uses the highest percentage of debt to finance its activities?
Step by Step Answer:
a Gross profit margin Sales Cost of goods sold Sales Net profit margin Earnings available for common ...View the full answer


Principles of Managerial Finance
ISBN: 978-0134476315
15th edition
Authors: Chad J. Zutter, Scott B. Smart
